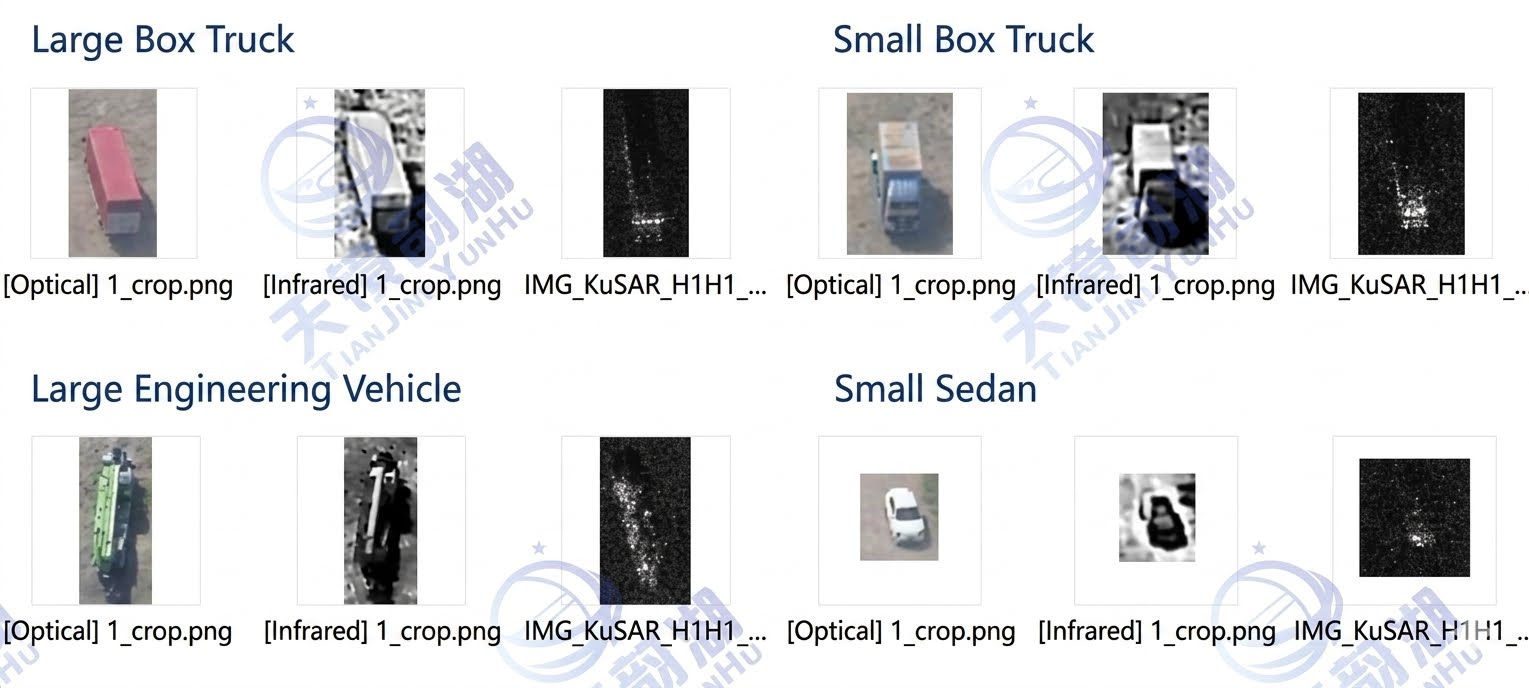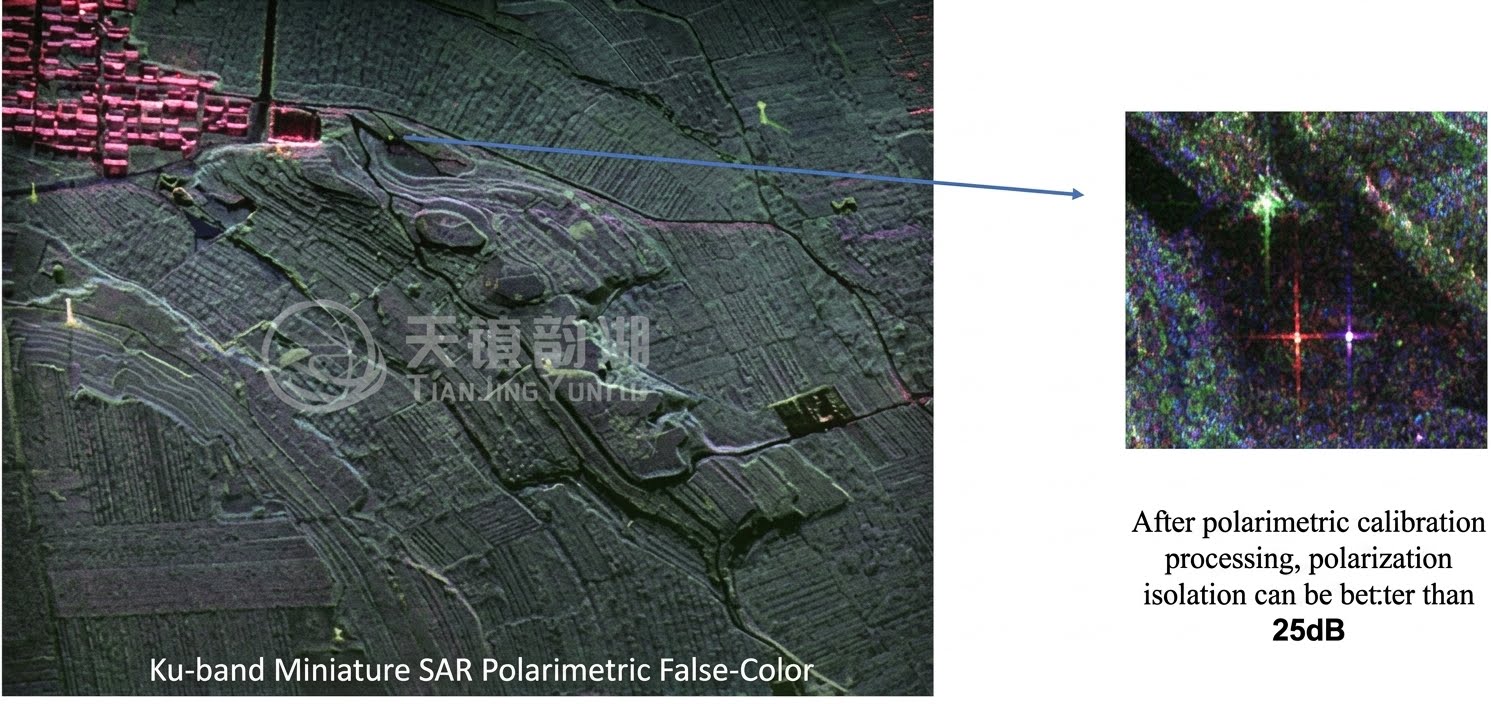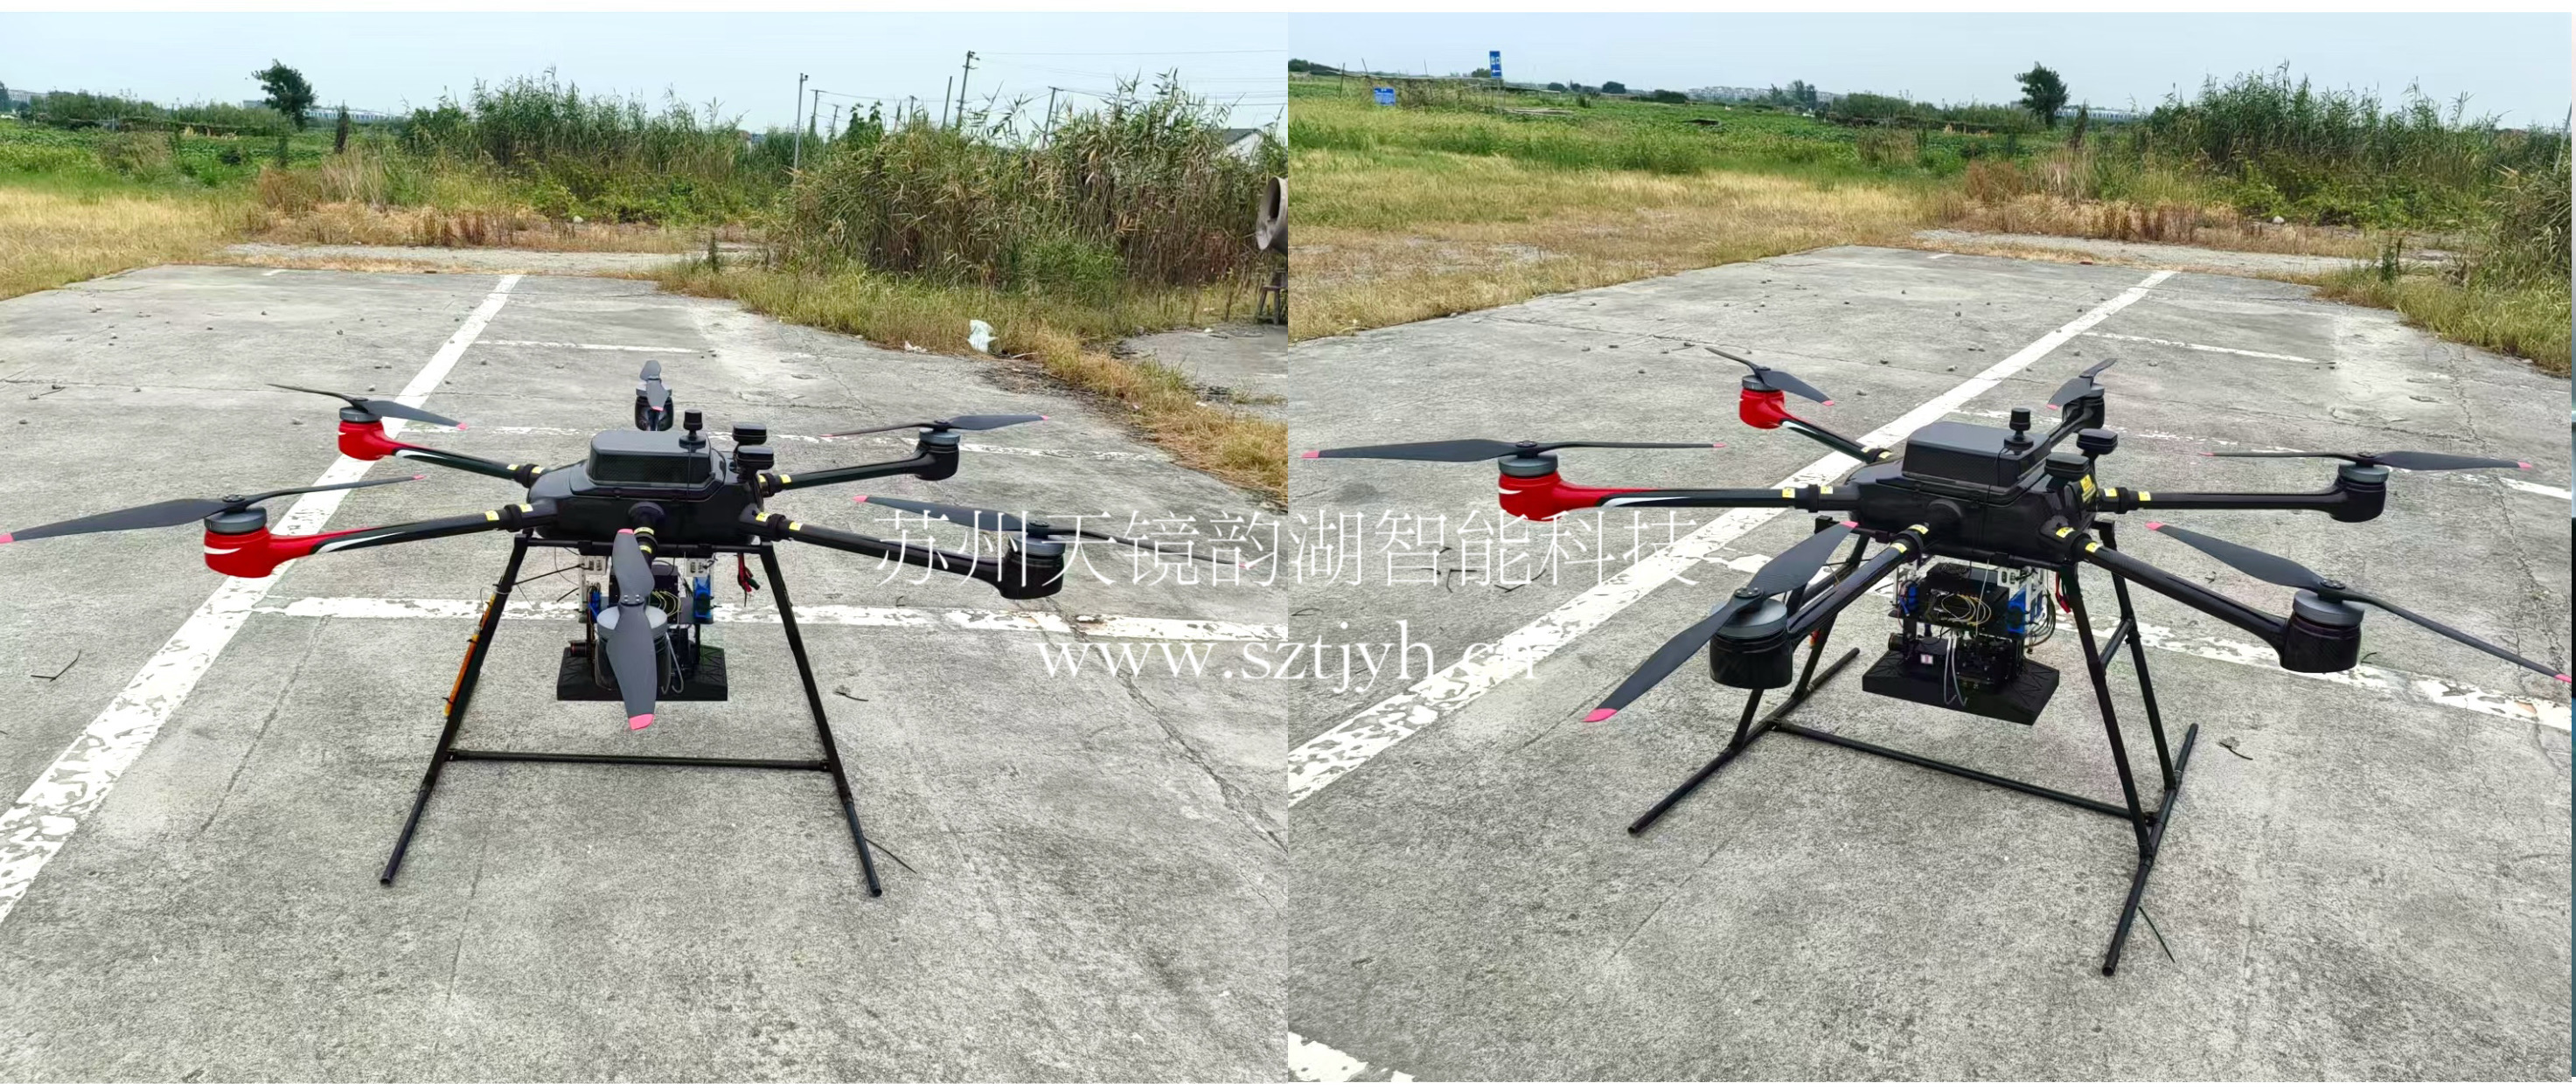

The quality of synthetic aperture radar (SAR) images directly affects the effectiveness of subsequent applications such as target recognition and parameter inversion. But how can we accurately evaluate SAR image quality? Tianjing Yunhu mainly focuses on three aspects: point target analysis, focusing performance (corner reflectors), and signal-to-noise ratio.
I. Point Target Analysis
Point targets are the most basic scatterers in SAR images, and their impulse response characteristics reflect the spatial resolution, sidelobe level, and peak fidelity of the imaging system. Key parameters for evaluating point target quality include peak-to-sidelobe ratio (PSLR), integral-to-sidelobe ratio (ISLR), and resolution broadening factor. Based on the numerical range of these indicators, point target quality can be classified into three levels: excellent, good, and poor.
(I) Superior Grade Image (Peak-to-Sidelobe Ratio: -20~-15dB)
At the superior grade, the main lobe of the point target is sharp, the sidelobe level is very low, and the energy is highly concentrated. The target outline in the imaging result is clear, and there are no obvious false targets or trailing phenomena. Typical images show: clean surroundings of the bright spot on the point target, smooth profile curves in the range and azimuth directions, and rapid sidelobe attenuation.
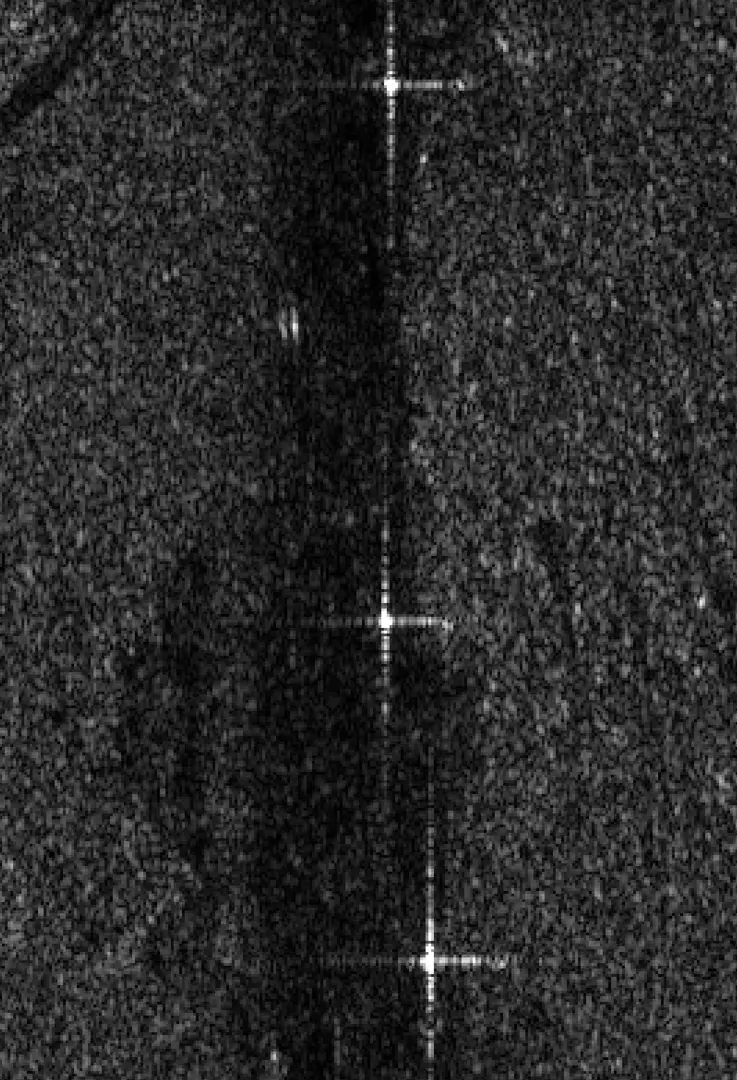
Point target quality test results:
Resolution: 0.16m in azimuth, 0.09m in range
Peak sidelobe ratio: -17.38dB in azimuth, -21.00dB in range
Integral sidelobe ratio: -13.81dB in azimuth, -17.85dB in range
(II) Good-quality images (peak-to-sidelobe ratio: -15~-10dB)
In good-quality images, the sidelobes are slightly increased, but still within an acceptable range. Slight ringing or secondary bright spots may appear around point targets, but these will not seriously interfere with the detection of nearby weak targets. This quality generally meets the needs of routine mapping and target recognition. The main characteristics are shown in the following figure:
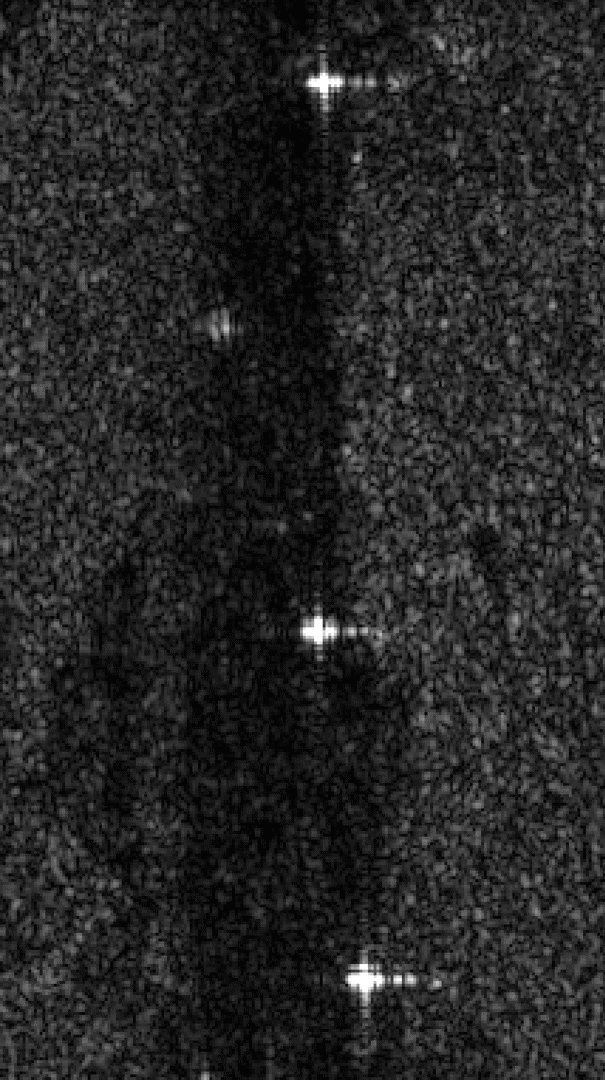
Point target quality test results:
Resolution: Azimuth 0.17m, Range 0.12m
Peak sidelobe ratio: Azimuth -12.46dB, Range -12.88dB
Integral sidelobe ratio: Azimuth -13.83dB, Range -10.23dB
(III) Differential-level images (peak-to-sidelobe ratio: <-10dB)
Different-level images are characterized by severely insufficient sidelobe suppression, with point target responses exhibiting significant main lobe broadening, excessively high sidelobes, and even false peaks. Numerous artifacts exist around the target in the image, easily leading to misjudgment.
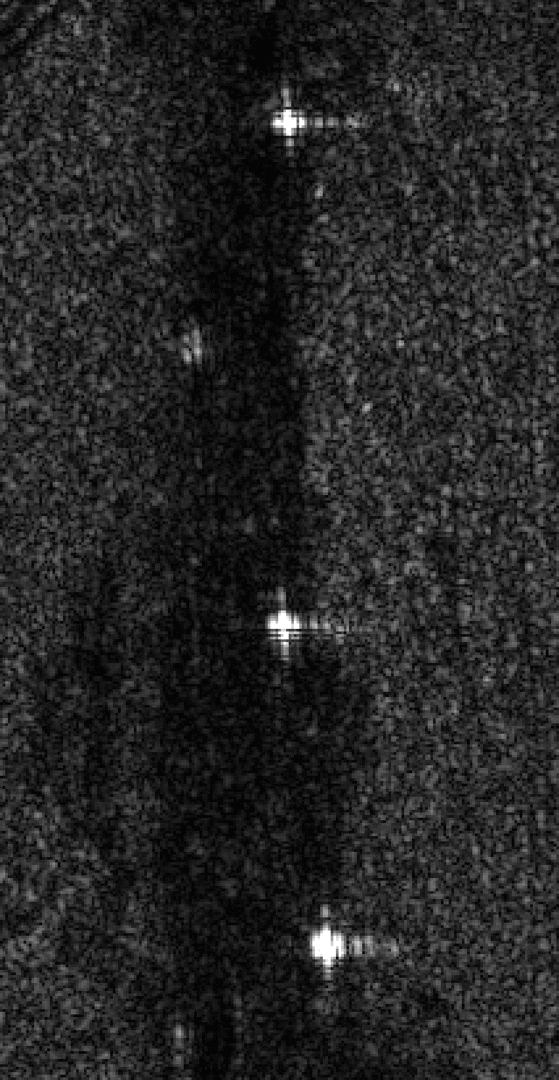
Point target quality test results:
Resolution: 0.20m in azimuth, 0.12m in range
Peak sidelobe ratio: -1.34dB in azimuth, -11.93dB in range
Integral sidelobe ratio: -0.84dB in azimuth, -10.09dB in range
II. Focusing Performance – Corner Reflectors
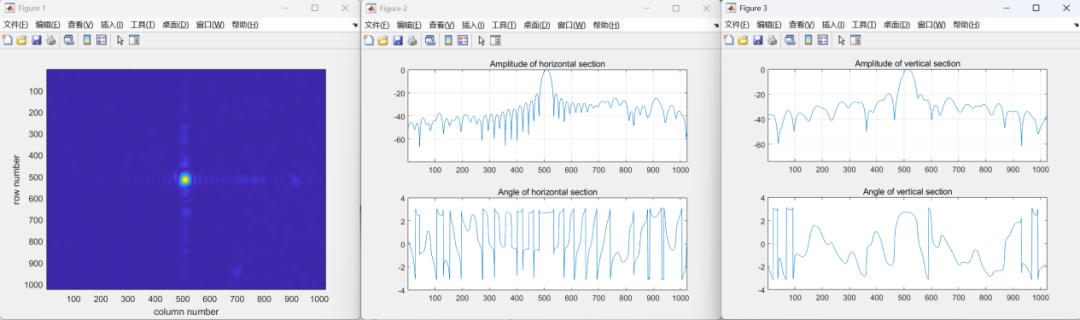
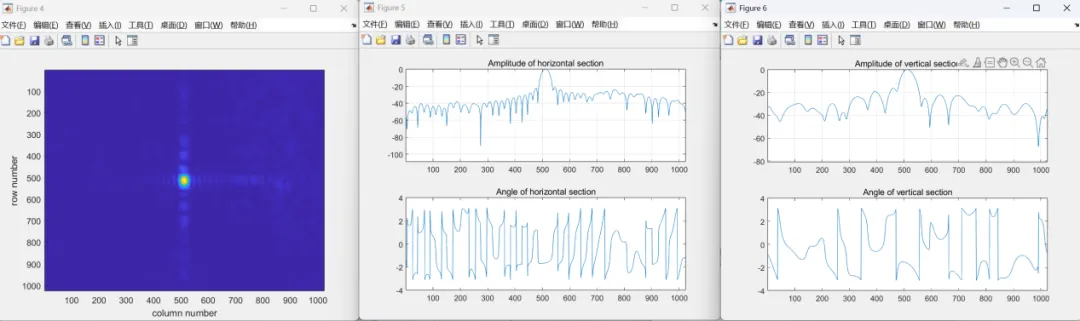
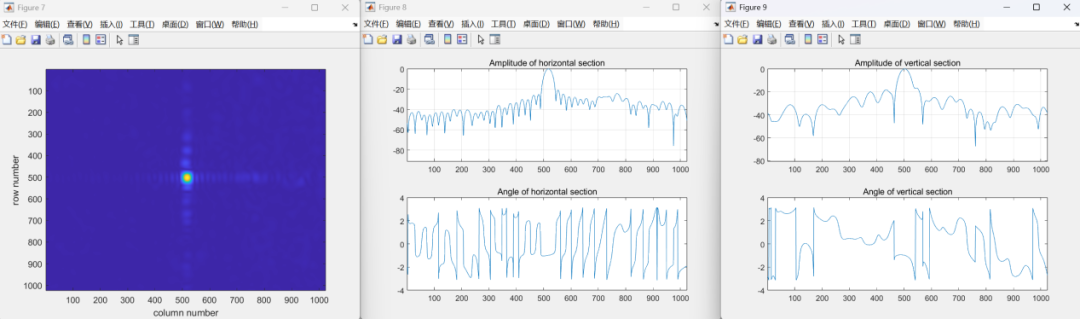
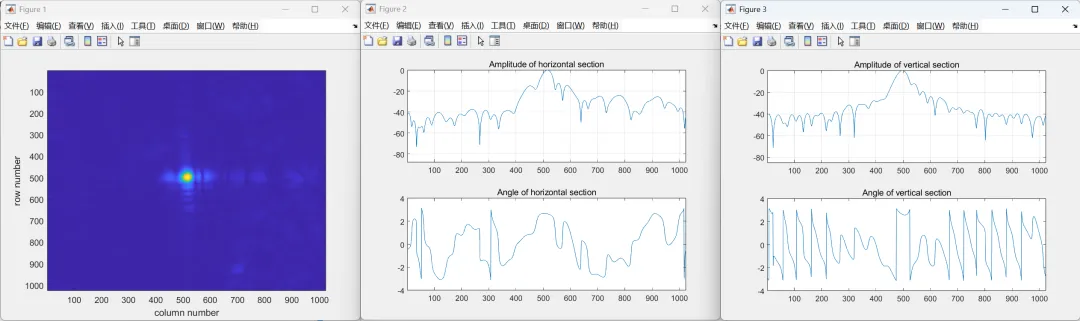
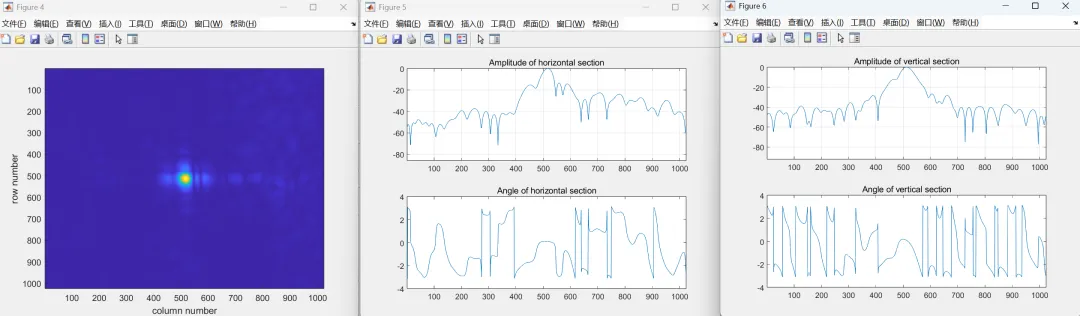
The second step involves selecting corner reflectors in the scene (such as Corner Reflector 1, Corner Reflector 2, and Corner Reflector 3) as ideal point targets. Their two-dimensional profiles, contour maps, and interpolated amplitude distributions are extracted, and the aforementioned metrics are calculated. Corner reflectors possess a definite radar cross-section (RCS) and a stable phase center, making them ideal calibration targets for evaluating the focusing quality of SAR images.
(a) Excellent image focusing performance
|
Corner Reflector 1: |
Corner Reflector 2: |
|
|
|
 Corner Reflector 3:
(b) Good image focusing performance
|
Corner Reflector 1: |
Corner Reflector 2: |
|
Corner Reflector 3: |
|
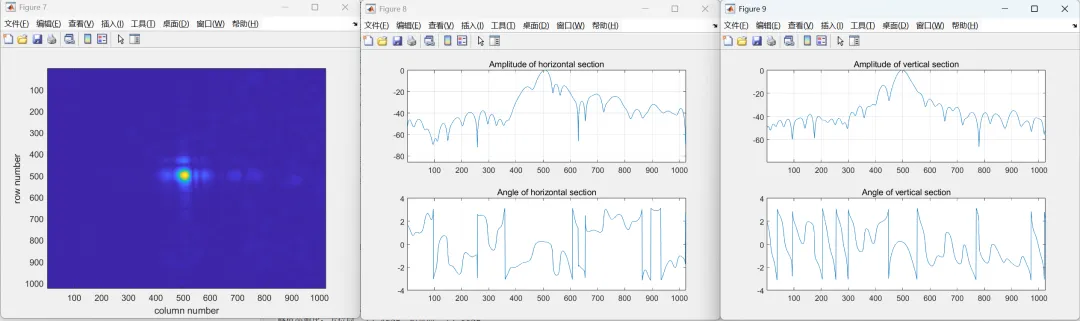
(c) Poor image focusing performance
|
Corner Reflector 1: |
Corner Reflector 2: |
|
Corner Reflector 3: |
|
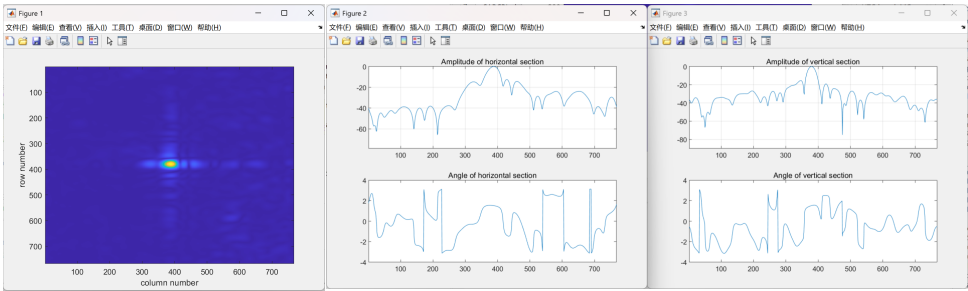
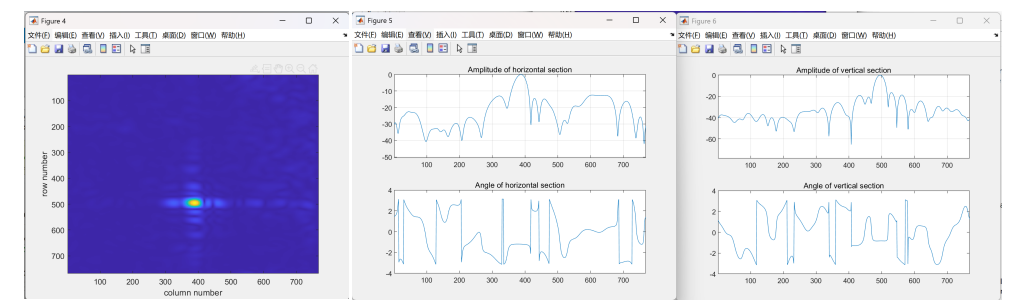
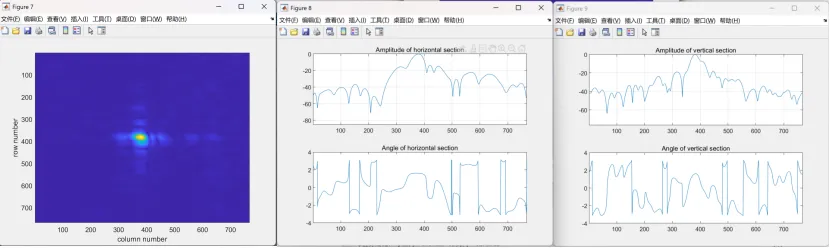
Tianjing Yunhu's synthetic aperture radar (SAR) image quality standards are as follows: First, a well-focused SAR image exhibits a clear and concentrated outline of the corner reflector, with smooth horizontal and vertical amplitude curves and prominent peaks. Conversely, an image with poor focus will show defocusing, trailing, and amplitude distortion on the corner reflector, directly reflecting deviations in the imaging algorithm, motion compensation, and system parameters. Therefore, Tianjing Yunhu uses corner reflector testing to quickly screen the focus quality of SAR images during product testing.
III. Signal-to-Noise Ratio (SNR)
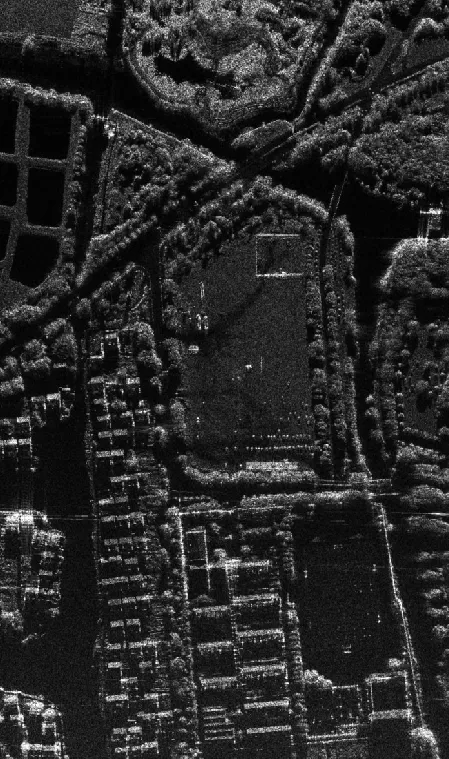
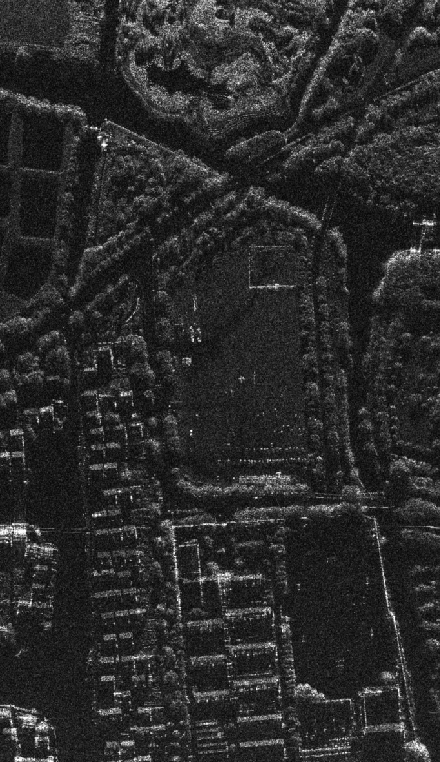
The third method is the signal-to-noise ratio (SNR), a fundamental indicator for measuring the relative strength of signal and background noise in a SAR image. NESZ ≤ -20 is the minimum threshold. Noise levels fluctuate significantly due to factors such as terrain, water bodies, and weather. A higher SNR means a larger proportion of effective signal in the image, less noise interference, and clearer details of ground features. Conversely, a lower SNR means noise can mask true ground feature information, leading to image blurring and increased artifacts.
|
Superior imaging |
Poor imaging |