
Synthetic Aperture Radar Interferometry (InSAR) technology, with its all-weather, 24/7 capability and high sensitivity to surface deformation, has become an important tool for geological hazard monitoring, ground subsidence investigation, and infrastructure health diagnosis. Integrating InSAR technology onto unmanned aerial vehicle (UAV) platforms further overcomes the limitations of long satellite revisit cycles, insufficient maneuverability, and high costs associated with manned operations, providing a new approach for regional, high-frequency, and high-precision deformation monitoring. However, the small size and susceptibility of UAV platforms to airflow disturbances make it difficult to maintain consistent flight paths during repeated flights, posing a significant challenge to double-track interferometry processing.
This article introduces our recent experimental progress in the field of L-band heavy orbit interferometric SAR for UAVs. Relying on our self-developed L-band radar system and multi-rotor UAV platform, and through rigorous experimental design and systematic data processing, we have successfully verified the millimeter-level deformation monitoring capability of UAV heavy orbit InSAR under real-world operating conditions.
I. Technical Advantages and System Composition of L-Band
Among the various operating bands of synthetic aperture radar, the L-band (frequency 1~2 GHz, wavelength 15~30 cm) is renowned for its strong penetration capability. Compared to shortbands such as X and Ku, L-band electromagnetic waves can effectively penetrate vegetation canopies and dry soil layers, maintaining good interferometric coherence even in vegetated areas. This characteristic gives it unique advantages in applications such as agricultural soil moisture monitoring, forestry resource surveys, underground target detection, and geological hazard identification.
The main technical parameters of the L-band radar system (XY1A-L) used in this experiment are as follows:
|
Parameters |
Specifications |
|---|---|
|
Center Frequency |
1.2 GHz |
|
Operating Mode |
dual-channel |
|
Signal Bandwidth |
400 MHz |
|
Center Downward View |
50° |
|
Beamwidth |
40° |
|
Slant View |
0° |
|
Side View Direction |
right-side view |
|
PRF |
781.25 Hz |
|
Side View Direction |
2.1 μs |
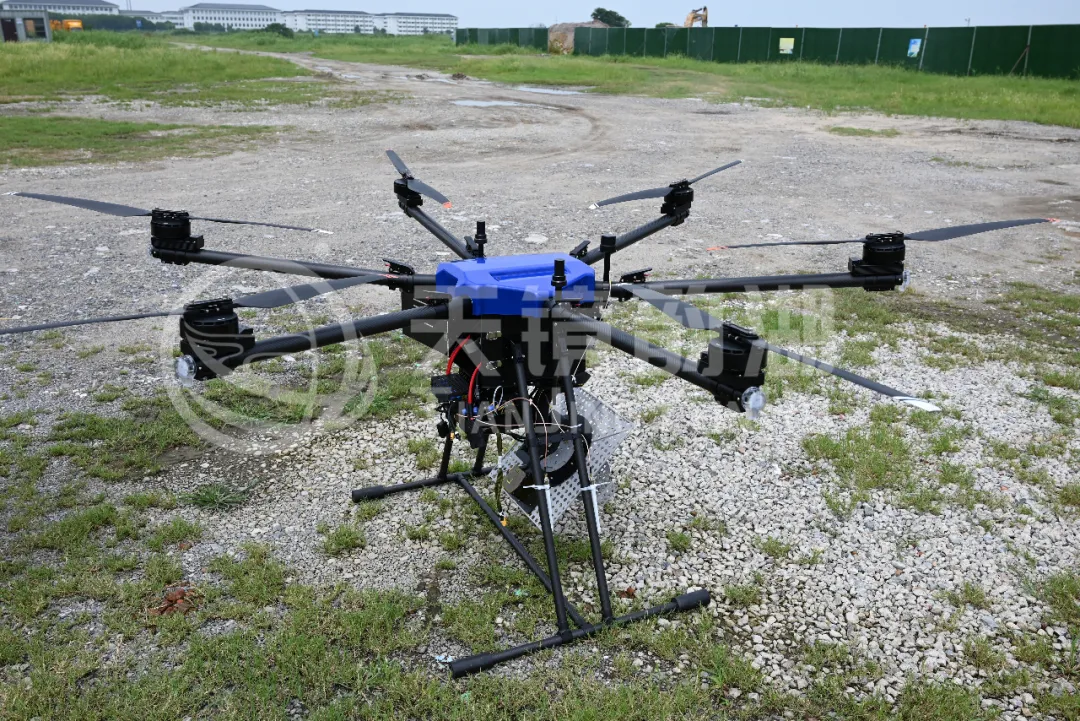
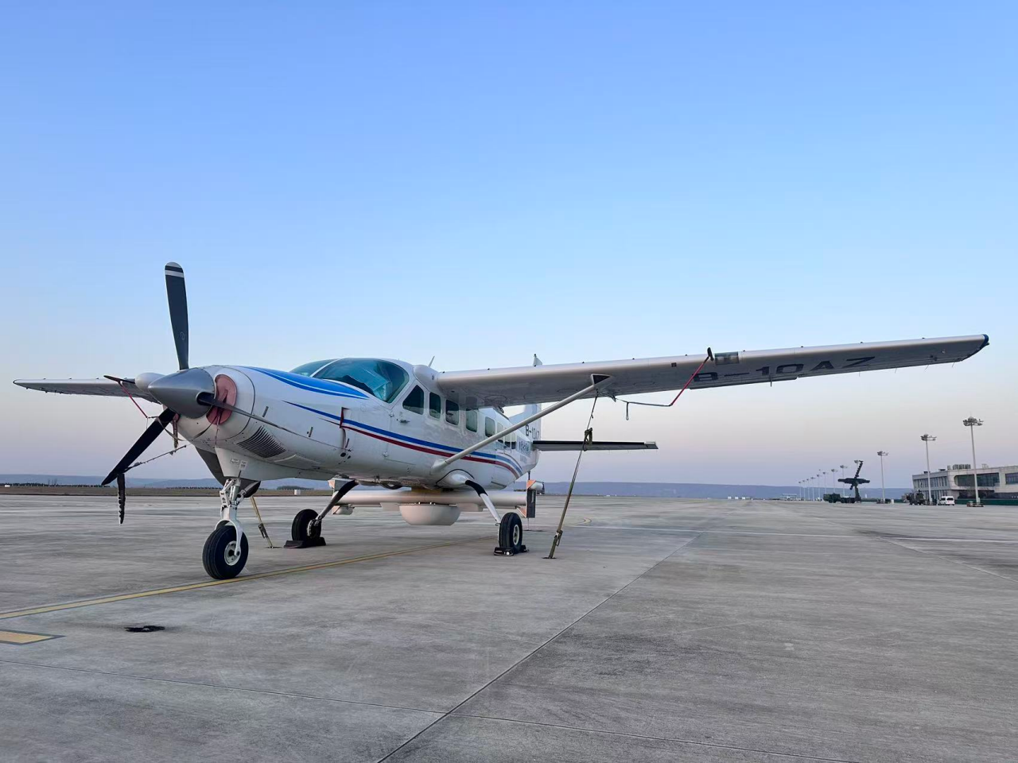
The system is mounted on the HY F1800Pro multi-rotor UAV platform, and its main hardware includes: XY1A-L radar host, servo-stabilized turntable, L-band RF antenna, combined inertial navigation FS-300 (supporting RTK/PPK high-precision positioning), data transmission link, and power supply system. The entire system achieves deep integration between the radar system and the UAV platform through modular integrated design.
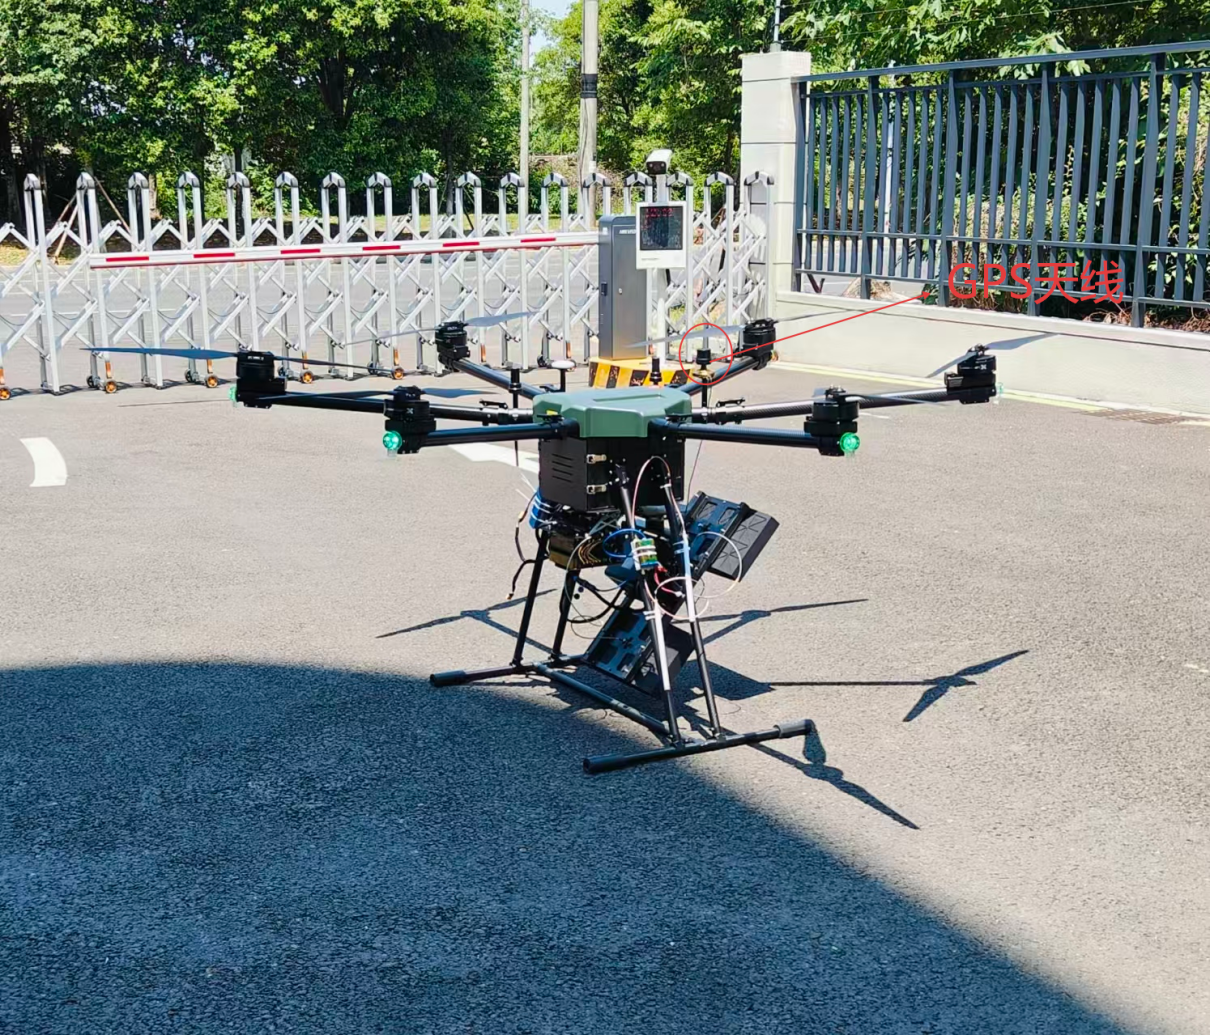
Physical assembly diagram
II. Ground Survey Area and Calibrator Deployment
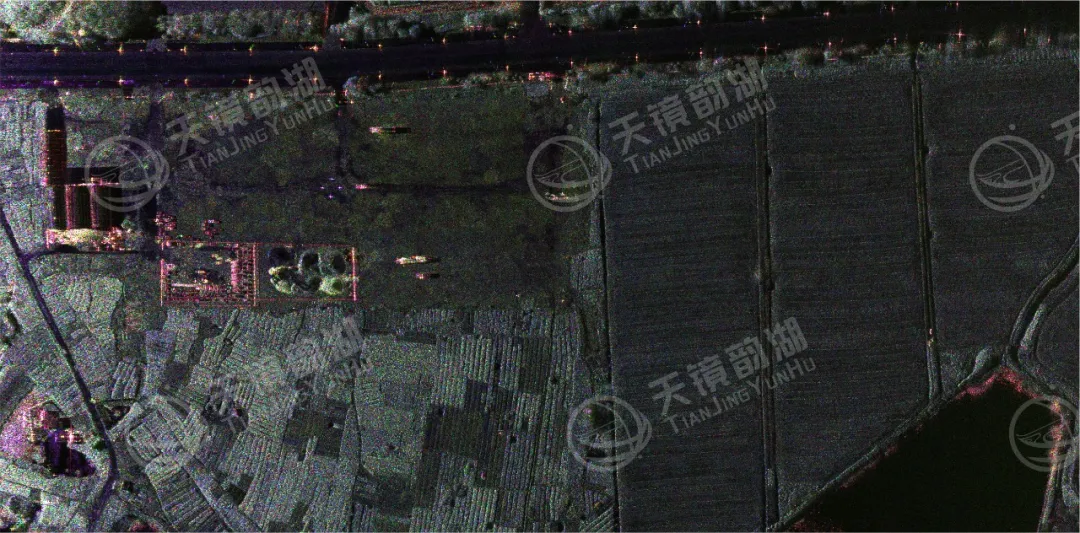
The ground survey area encompassed various typical land cover types, including near-end farmland, exposed gravel ground, lakes, and distant waterways and building complexes, aiming to fully verify the system's interferometric performance under different land cover conditions.
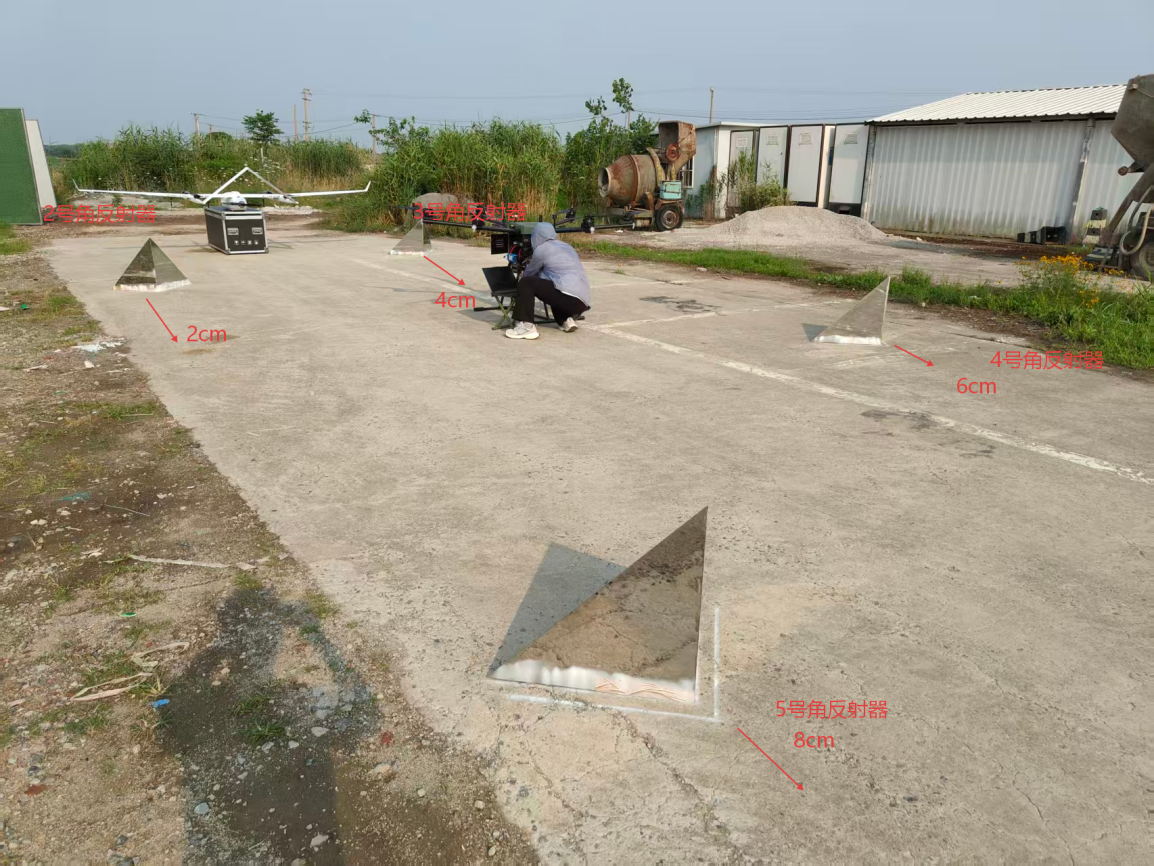
To quantitatively evaluate the deformation monitoring accuracy, five 0.6 m × 0.6 m trihedral reflectors were deployed within the survey area. Reflector No. 1 was placed in the grass, while the other four (Nos. 2-5) were placed on a concrete surface. During the experiment, reflectors Nos. 2-5 were displaced by 2 cm, 4 cm, 6 cm, and 8 cm in the distance direction, respectively, to simulate different magnitudes of land deformation. Reflector No. 1 remained stationary as a reference point.
 |
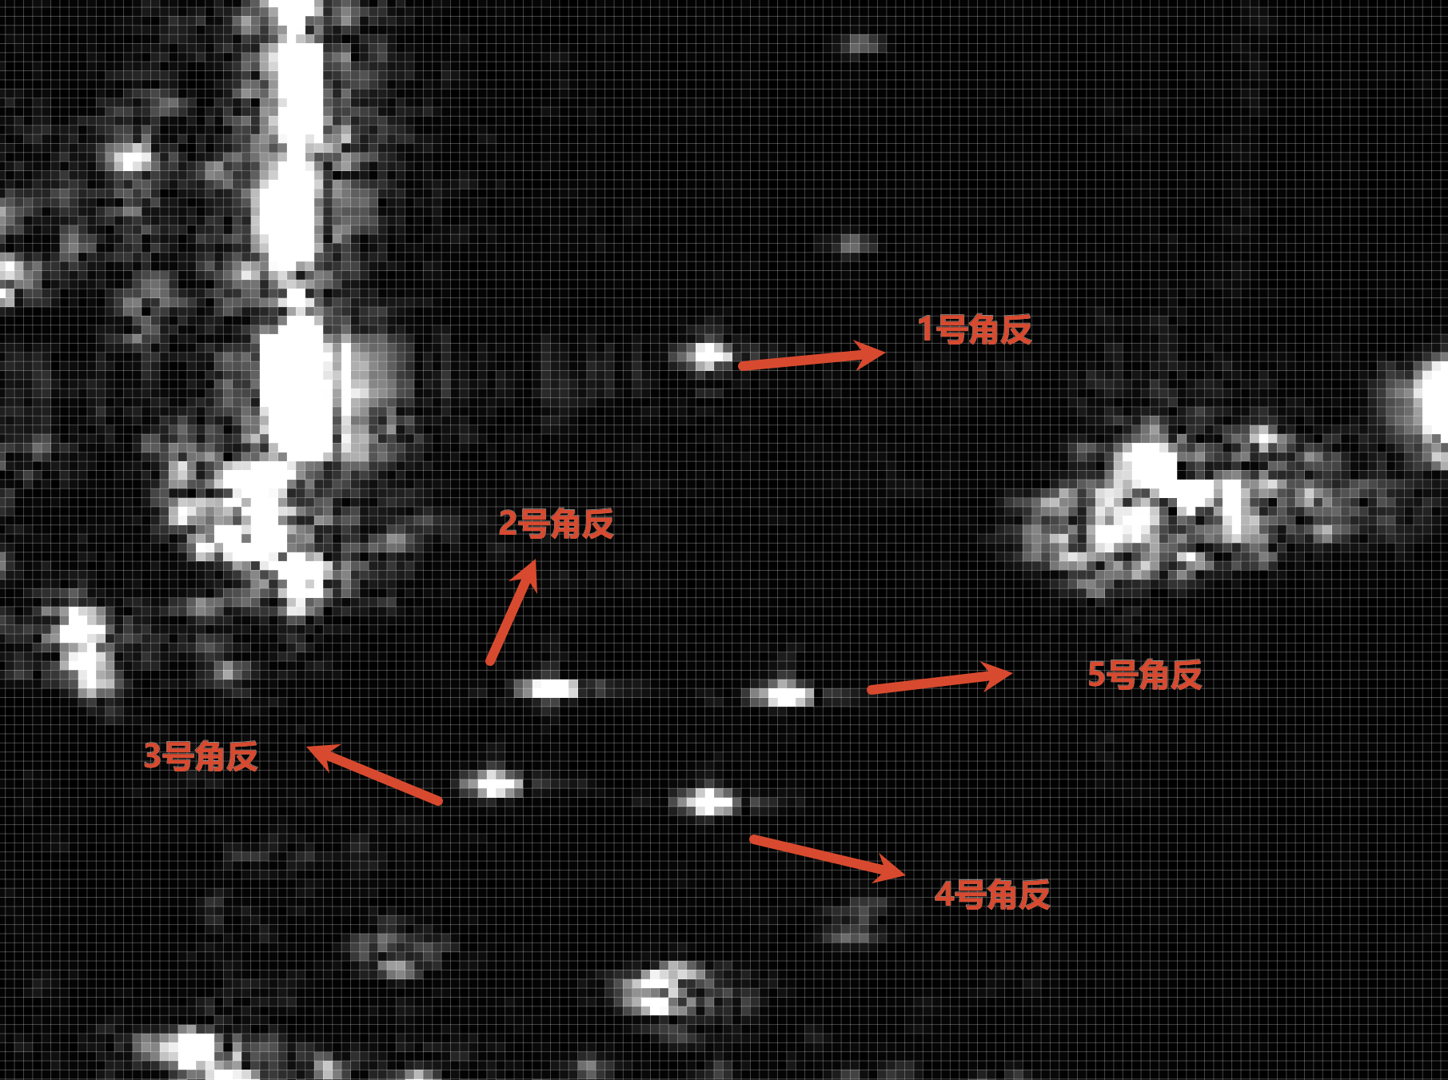 |
| Corner reflector layout | Sharp echo features of corner reflectors in single-polarized DOM images |
III. Key Technologies for Data Processing
(a) High-precision heavy-track trajectory control
Repeat orbit interferometry requires extremely high consistency between the two flight paths. This system, utilizing a multi-rotor UAV platform equipped with an RTK navigation module, achieved decimeter-level accuracy in repeat orbits under level 2 wind conditions, laying a solid foundation for high-quality acquisition of subsequent interferometric phases.
(b) High-precision motion compensation and imaging processing
Data processing is divided into two stages: First, Inertial Explorer software is used to perform POS data post-processing, and PPK (Dynamic Post-Processing Differential) is used to obtain high-precision trajectory information; then, SAR imaging processing software is used to complete radar imaging, including radar parameter correction, antenna phase center (APC) position import, relative flight altitude and ground reference altitude setting, etc., and finally generate single-polarization and fully polarized DOM images.
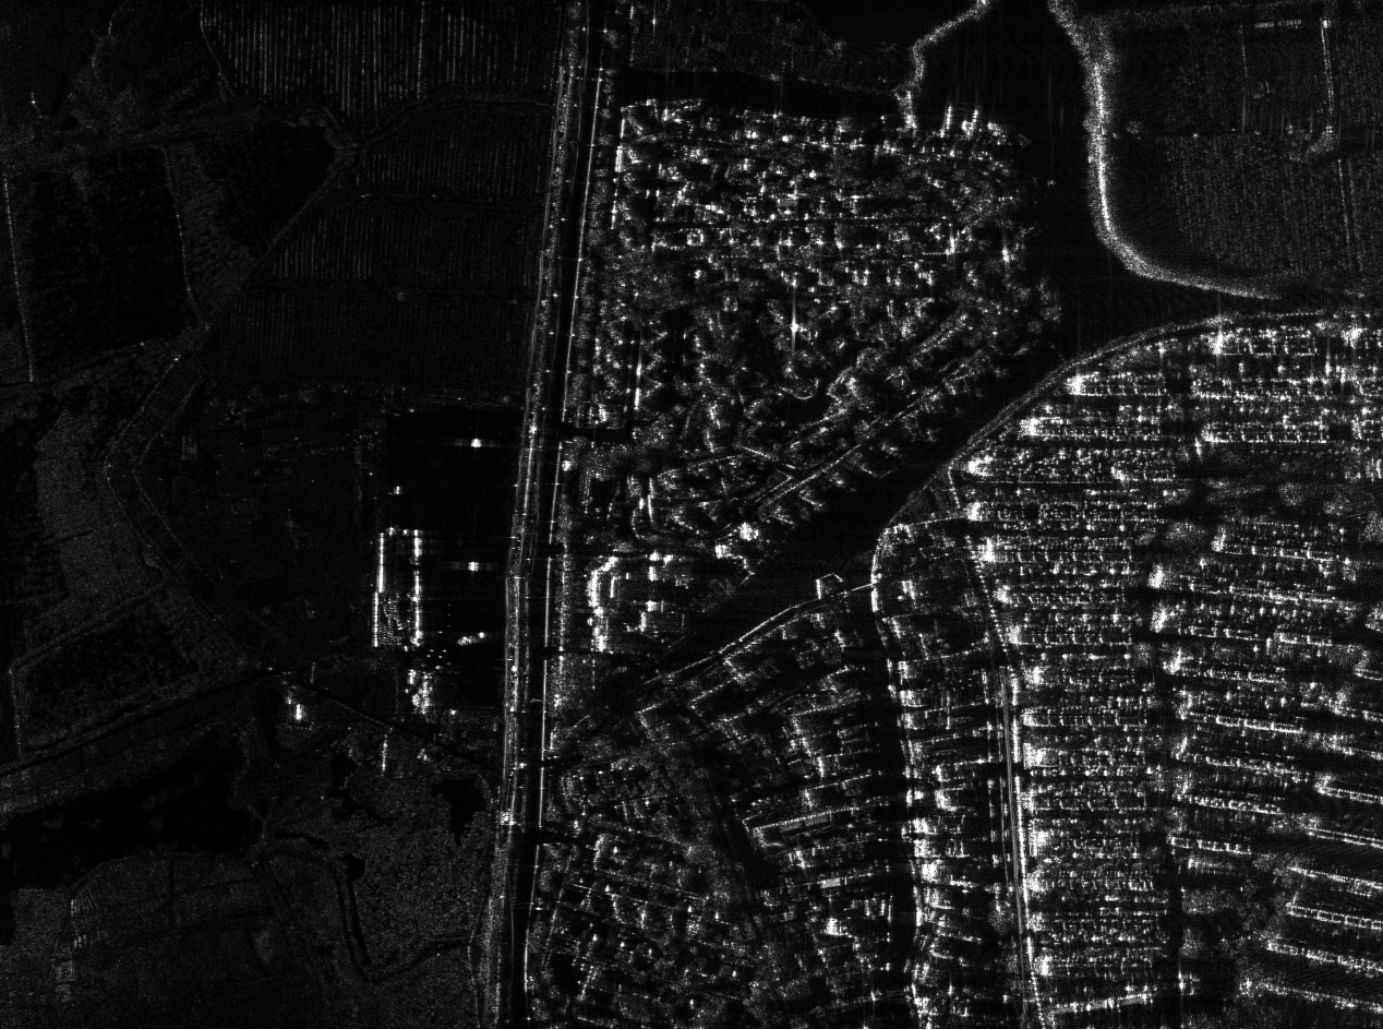
Single-polarization DOM image
(c) Interference processing link
The standard interferometric processing workflow is completed using GAMMA software: image registration, interferogram calculation, baseline estimation, removal of flat-ground effect, coherence calculation, adaptive filtering, refined baseline estimation, phase conversion deformation, and finally, deformation field generation.
IV. Experimental Results and Analysis
(a) Coherence Analysis
Coherence is a core indicator for measuring the quality of interferometric phase. Experimental results show that the coherence coefficient in farmland and building areas is generally greater than 0.8, indicating high coherence; in water areas, due to specular reflection, the coherence coefficient is below 0.4; and in some road areas, the scattering characteristics change frequently due to vehicle traffic, resulting in relatively low coherence. These results verify that the L-band has a weak decoherence effect on low-lying vegetation and can still maintain good interferometric measurement capabilities in vegetated areas.
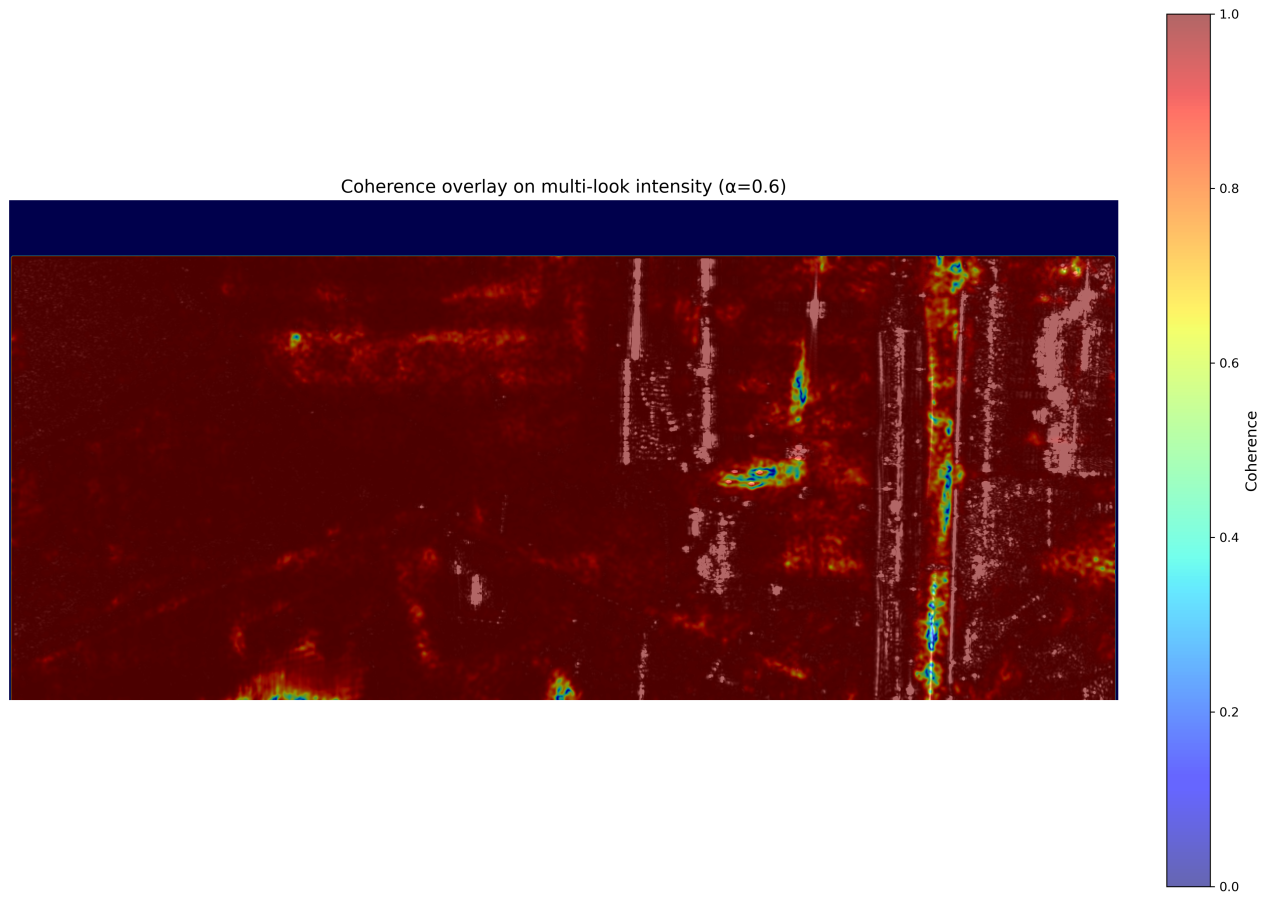
Coherence diagram
(b) Verification of Deformation Measurement Accuracy
By comparing the actual displacement values of the five corner reflectors with the InSAR deformation monitoring results, the deformation measurement accuracy of the system was quantitatively evaluated. The results are shown in the table below:
|
Corner Reflector |
Actual Deformation Value(cm) |
Monitored Deformation Value(cm) |
Accuracy (Difference) |
|
Corner Reflector 1 |
0.0 |
0.18 |
0.18(1.8mm) |
|
Corner Reflector 2 |
2.0 |
1.6 |
0.4 |
|
Corner Reflector 3 |
4.0 |
4.12 |
0.12 |
|
Corner Reflector 4 |
6.0 |
5.9 |
0.1 |
|
Corner Reflector 5 |
8.0 |
8.18 |
0.18 |
Table. Comparison of Deformation Measurement Accuracy of Corner Reflectors
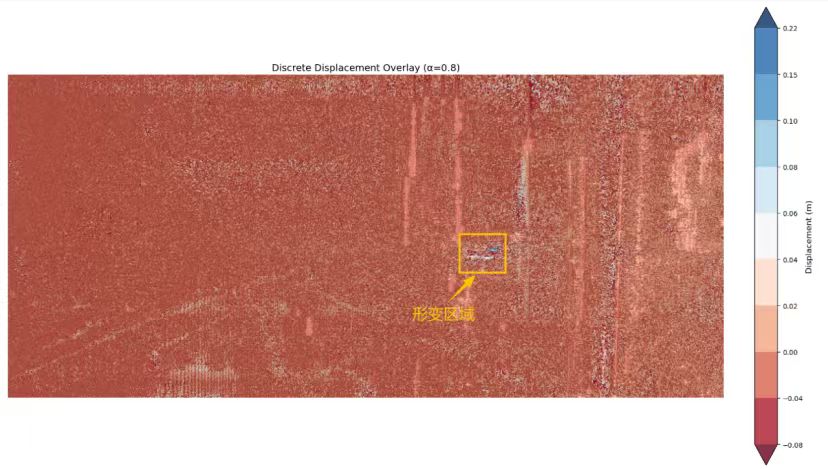
As can be seen from the table, the difference between the deformation monitoring value and the actual deformation value corresponding to each corner reflector is small, with the maximum difference being about 4 mm and the minimum difference being only 1 mm, which verifies that the system has high deformation measurement accuracy.
 |
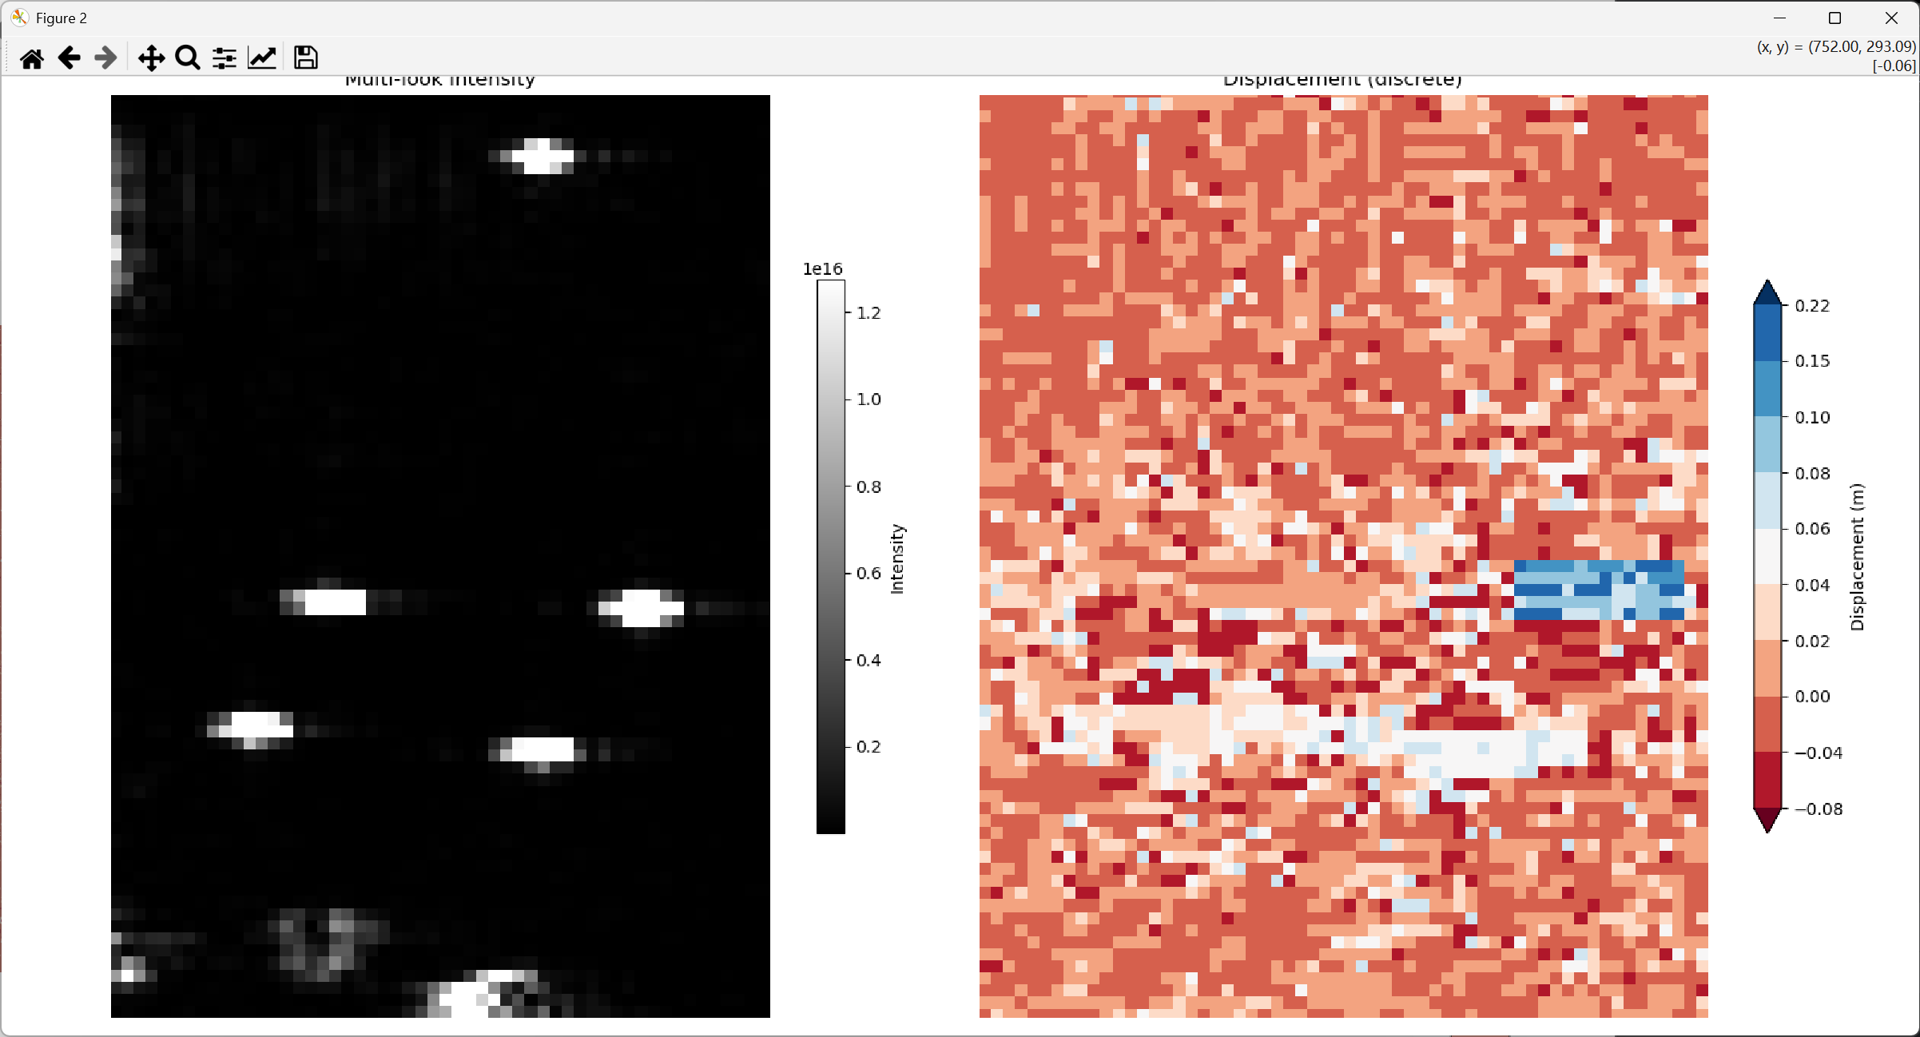 |
| Deformation diagram | Corner reflector deformation diagram (left: amplitude, right: deformation) |